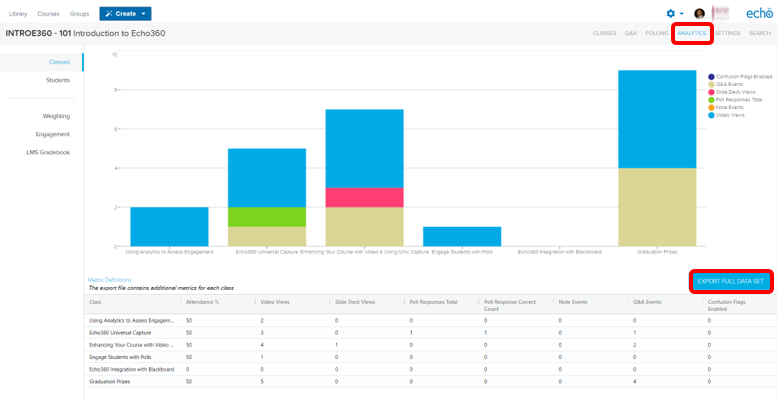
Analytics enables instructors to monitor student engagement with videos and other Echo360 course content. For example, an instructor can view the analytics for a specific video to determine which students have reviewed it and which haven’t. Conversely, an instructor may want to view such data across the entire class roster to see which students are engaged and which aren’t.
- To view the Analytics for your Echo360 course, first select the desired course from the course list.
- Once you have selected your course, click on the Analytics tab on the top far right of the course page.


The Classes section of the Analytics page provides an overview of the engagement by class and denotes, in different colors, the type of engagement (i.e., whether students watched the video/recording, took notes, answered polling activities, and participated in discussions.)
Note: Echo360 scores attendance as the percentage of time a student engages with Echo360 content during the specified class window. For further details on how Echo360 scores attendance, as well as other means of engagement, click here.
The Students section of the Analytics page provides a class roster of engagement by student.

To export the data into an Excel friendly format, click on the Export Full Data Set button.
Take note of the Weighed Engagement score assigned to each student. This metric is calculated based on the importance assigned to each criterion on the Weighting page.

To adjust the importance, click on the Weighting tab and drag the sliders as needed or use a preset from the right and click the Apply button.
For example, if your Echo360 course uses lots of videos but very little discussions and polling, you may want to weigh video views 2x or 3x higher than students’ engagement with polling activities. Alternatively, if your course is purely video/recording base, you should set the Video slider to 100%.
The Engagement section shows a quick summary of which students are engaged and which aren’t. To the right, it lists which students have added notes or flagged content as confusing.
Instructors using Blackboard will find the LMS Gradebook feature useful. It facilitates the import of Echo360’s engagement metrics (Activity Participation %, Activity Score %, Attendance, and Engagement Score) into the linked course’s Grade Center. For more information on using this feature, click here.
