Close Menu
    Facebook X (Twitter) Instagram
    Return to Fordham Law School
    X (Twitter) Facebook LinkedIn Instagram RSS
    Remote Teaching
    • Getting Started
    • Strategies
      • Communicate With Students
      • Distribute Course Materials and Readings
      • Foster Communication and Collaborate Among Students
      • Collect Assignments
      • Assess Student Learning
    • Blackboard
      • Getting Started with Blackboard
      • Posting a Syllabus in Blackboard
      • Organizing Class Materials in Blackboard
      • Linking and Embedding Videos in Blackboard
      • Posting Announcements in Blackboard
      • Additional Blackboard Features
    • Echo360
      • Getting Started with Echo360
      • Linking Zoom recordings to an Echo Course
      • Uploading Recordings to Echo360
      • Editing and Sharing Content in Echo360
      • Embedding Echo360 Videos to Blackboard Courses
      • Additional Echo360 Features
    • TWEN
      • Getting Started with TWEN
      • Creating a Course in TWEN
      • Adding Students to Your Course in TWEN
      • Posting a Syllabus and Course Materials in TWEN
      • Creating an Assignment in TWEN
      • Additional TWEN Features
    • Zoom
      • Getting Started with Zoom
      • Scheduling a Zoom Meeting
      • Sharing Content in Zoom
      • Recording a Zoom Meeting
      • Sharing a Zoom Recording through Echo360
      • Additional Zoom Features
    • Accessibility and Support
    Return to Fordham Law School
    X (Twitter) Facebook LinkedIn Instagram RSS
    Remote Teaching
    You are at:Home»Echo360»Analytics in Echo360

    Analytics in Echo360

    0
    By Law IT Staff on May 26, 2020 Echo360

    Analytics enables instructors to monitor student engagement with videos and other Echo360 course content. For example, an instructor can view the analytics for a specific video to determine which students have reviewed it and which haven’t. Conversely, an instructor may want to view such data across the entire class roster to see which students are engaged and which aren’t.

    1. To view the Analytics for your Echo360 course, first select the desired course from the course list.
    2. Echo360 screenshot - Analytics COurses

    3. Once you have selected your course, click on the Analytics tab on the top far right of the course page.
    4. Echo360 screenshot - Analytics Tab

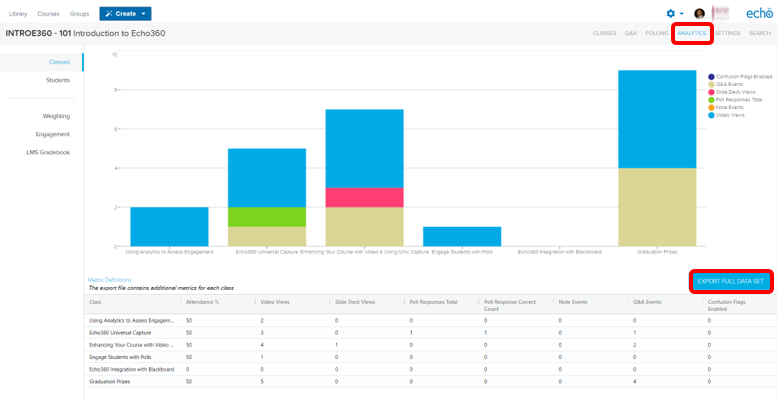
      The Classes section of the Analytics page provides an overview of the engagement by class and denotes, in different colors, the type of engagement (i.e., whether students watched the video/recording, took notes, answered polling activities, and participated in discussions.)

      Note: Echo360 scores attendance as the percentage of time a student engages with Echo360 content during the specified class window. For further details on how Echo360 scores attendance, as well as other means of engagement, click here.

      The Students section of the Analytics page provides a class roster of engagement by student.

      Echo360 screenshot - Analytics Students

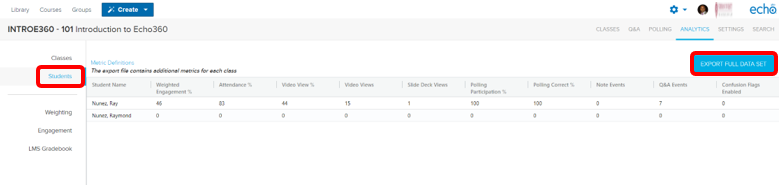
      To export the data into an Excel friendly format, click on the Export Full Data Set button.

      Take note of the Weighed Engagement score assigned to each student. This metric is calculated based on the importance assigned to each criterion on the Weighting page.

      Echo360 screenshot - Analytics Weighting

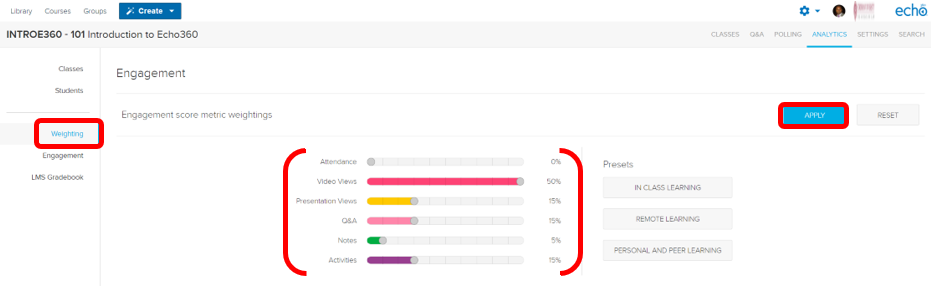
      To adjust the importance, click on the Weighting tab and drag the sliders as needed or use a preset from the right and click the Apply button.

      For example, if your Echo360 course uses lots of videos but very little discussions and polling, you may want to weigh video views 2x or 3x higher than students’ engagement with polling activities. Alternatively, if your course is purely video/recording base, you should set the Video slider to 100%.

      The Engagement section shows a quick summary of which students are engaged and which aren’t. To the right, it lists which students have added notes or flagged content as confusing.

      Instructors using Blackboard will find the LMS Gradebook feature useful. It facilitates the import of Echo360’s engagement metrics (Activity Participation %, Activity Score %, Attendance, and Engagement Score) into the linked course’s Grade Center. For more information on using this feature, click here.

    Share. Facebook Twitter Pinterest LinkedIn Tumblr Email

    Comments are closed.

    Teaching Resources
    Select a teaching tool
    • Blackboard
    • Echo360
    • TWEN
    • Zoom
    Additional Resources
    • Microsoft PowerPoint
    • Google Drive
    • Poll Everywhere
    • Fordham EdTech Resources

    Workshops and Training
    • Pedagogical Workshops
    • Fordham IT Training Sessions

    Some of the information in the "Strategies" section of this site is borrowed from the Teaching and Learning Center of Indiana University. Credit is given to the authors at Indiana University.

    Type above and press Enter to search. Press Esc to cancel.